Fall detection
ML model:
As the original dataset is extremely imbalanced, the ratio of the minority (falls event) and the majority of samples (normal behaviors) is 0.0576. Therefore, evaluation by the commonly used accuracy is meaningless and misleading. By our further study, we choose F1- score as our main metric to evaluate the performance of the model.
As F1-score values equally on precision and recall, we expect our model can capture all the potential fall events. To reach this aim, we need a model with recall (sensitivity) as high as possible, and a relatively high precision to reduce false alarm. So, our basic methodology is that firstly through the value of F1-score, we could get an
intuitive reflection on how the model performs and by further checking the precision and sensitivity to determine whether the model should be adopted. The final result on average has a F1-score of 0.941 (10-fold stratified), and the corresponded recall and precision respectively are 0.998 and 0.891. Although it is difficult to find a past research
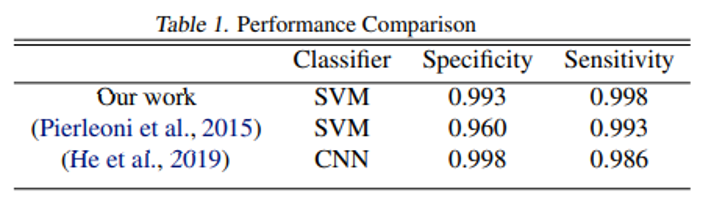
that has used the same dataset and same metric, most of previous research do take sensitivity and specificity as their metrics. Also, we cannot confirm what dataset they used in some of the research. As a comparison, we calculated the specificity and sensitivity of our model with best F1-score and the result is presented in the table on the right.
App:
We have integrated the app interface with the fall-detection backend. Therefore, we are able to do quantitative tests on different scenarios. Please note that these tests mainly aim to test the usability of the fall-detection function but not the reliability or correctness (to prove these we obviously need to do more systematic tests with more scenarios
and trial times). The test results contain two scenarios:
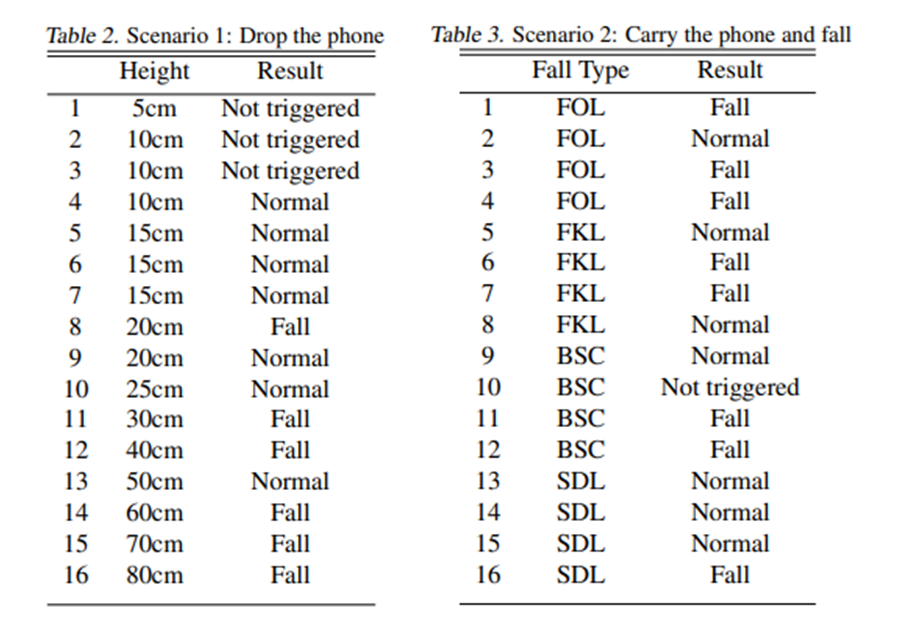
The first scenario is physically dropping the phone from a certain height with a pad on the ground as a buffer. The second scenario is that carrying the phone (in pocket) and performing 4 types of fall trials which contains:
FOL:
Fall forward from standing, use of hands to dampen fall.
FKL:
Fall forward from standing, first impact on knees.
BSC:
Fall backward while trying to sit on a chair.
SDL:
Fall side wards from standing, bending legs.
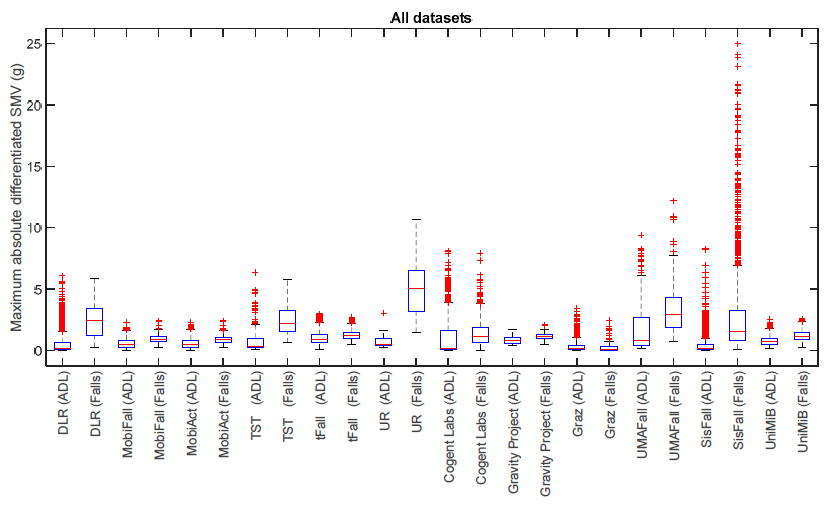
As the result indicates, the performance of the fall detection classifier is not good as our expectation. More specifically, we found that the data we acquired from our App is incompatible with the data we used for training (MobiAct), which might be the reason for it. In our many trials, some features (for example the maximum SMVs) within a window period of time is
greater than that value of we extracted from the whole training dataset. We have also found hints in a
research study that compares different public datasets for fall detection system as seen in the figure below. We can see from this figure that the value of this feature is generally lower than the same in other datasets. To solve this incompatible issue,
we need to combine other public dataset or to collect data by ourselves.